The setups I include on this blog are used in conjunction with the 3/10macd and the criteria I ascribe to it as a way to alert me to an existing condition of price. The key concept to take away from this blog is that I try to anticipate what will happen on the higher time frame by using a faster time frame to trigger the trade setup. I do not trade a "system" I use two indicators to clue me in to price conditions. Please read the Disclaimer located in the sidebar of this site. I can be contacted via email at toddstrade@gmail.com
I am always open to questions, comments, or suggestions on how to improve this blog.


Thursday, May 27, 2010

Just Charts

Simply for my personal reference.
RIMM was so nice today as it based on my pivot line all day before ripping into the closeDaily chart with potential resistance near-term:
POT
Relentless to the upside today once it got through it's previous congestion zone
60-min
30-minFCX has moved nearly 10% in 3 days...me thinks it could consolidate in that$73-$74 range:
those immediate pullbacks to the lower/upper median line typically play out great

Transports

Dow Jones Transportation Index (or the IYT etf) Were a good tell today.
Before the breakoutAfter the breakout

Supply

A lot of overhead supply in this market. It seems we gear up for a "healthy" bounce only to get caught up in thickets of supply. {updated chart}
Though that Euro issue just doesn't seem to be going away...{updated chart}
However, bottoms don't happen in a day. Currently there is a potential inverse Head & Shoulders pattern here...{updated chart}
looking for buying interest between here and 1060. Any lower and I would suspect a move beyond the recent lows.
Looking back at February's sell off you can see how much energy goes into a bottoming process.
On the way down, rallies are held cautiously and selloffs are taken aggressively, continuing a lower low/lower high profile.On the way up, rallies are held cautiously and selloffs taken aggressively, causing a shift to higher highs/higher lows. In the process, consolidation ranges build up (acceptance of price) until a break out/down occurs.

Monday, May 24, 2010

Crude & Gold

Crude seems to be losing steam on it's "bounce"Gold is curious. After putting in a 2-b top, price put in a higher low & higher close today.
Watching to see if it tests $1220 and whether it shows a lower high, or recoversTreasuries (TLT)
put in 2 lower highs, with a close less than the Open

POT ahead

First the weekly. Broke down from a trend line and selling seems to keep overtaking buyers. Sitting right on top of that prior sideways range +/- $96The daily chart showing potential support, perhaps an area one should be alert for a potential shakeout move.
Price is consolidating in a tight range within the "flash crash" tail
60-min chart highlighting that horizontal rangeFinally, we got what looks like support range between $96-96.50

RIMM at pivot

RIMM is testing a long-standing pivot in the $60 range.
weekly chart:
First sensible area of support is underneath at $58.
Daily Chart:
That is, if it's not ready to bounce on tomorrow's opening range
30-min chart: $58-ish looks to have some solid support, unless there's broad market mayhem in bounds.

Here's another little gem I found

Friday, May 21, 2010

Piercing Line

DIA & IWM printed a slight lower low (versus the "flash crash" tail), but still held above our previous February pivot. The SPY gave us a higher low and a nice Piercing line pattern with a strong rally into the close, setting up an inevitable bounce going into next week.

Thursday, May 20, 2010

Divergences

A momentum divergence is a momentum divergence, and SO FAR, these issues at least have that going for them.
RIMM; in it's 3rd push down on lighter momentum. It spent most of the day in a very narrow range and sold off later in the day due to the weight of the overall market (margin calls).FCX; has had the feel like people are anxious to jump aboard this one for "the bounce."
POT; though technically not a momentum divergence (yet), it to has had a similar feel like people are waiting to ride this for a bounce. Of interest is the inverted hammer candle today.

SPY touchback

The SPY retraced back to its Upper Median Line on the open this morning and has been slipping down ever since.

and here's the updated chart:
re-update:

re-re...

Monday, May 17, 2010

Q seed wave

Two seed waves in one issue in one day, pretty cool. I traded the first one, but the second one I didn't get a good read on, and became doubtful it would reach it's targets. The morning was a failure test of the highs:
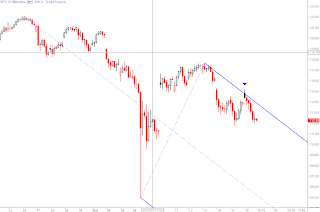
The afternoon showed a lot steeper retracements (quick profit taking)

Friday, May 14, 2010

POT Squeeze

POT bounced a little above $100 this morning, igniting a short squeeze back to previous acceptance, which was then rejected (longs covering? shorts entering).
Here's the daily showing a minor support level at today's lows.Today's entry:
Why enter short up there? Previous day's VPOC (while under today's lows was also a VPOC).
Looking at the price distribution, today's resistance level was a previous price congestion level, take a look at all those POC's: