....but RIMM pulled me back in. I took RIMM off my watchlist a while ago, but still peek at it every now and again. The setup was a double bottom, with a strong momentum candle followed by a tight flag. Target was initially the 50% extension measured off of the W-bottom wave, but it was showing strength at that point (as was the rest of the market), so a target after that was the 100% extension. Not that you needed a 3/10 macd criteria for this setup, but the 3a criteria is still a good long condition, especially when the slow line is trending so solidly up.
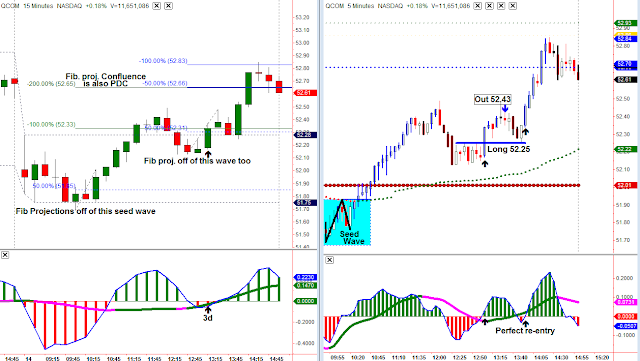
QCOM was an unfortunate result for me. Entered long on the 3d condition, exited at what I thought might be a double-top (was uncertain of which way the market might turn at this point) so I exited. I had the opportunity to get back in long, but failed to re-enter. The Fib. levels marked here are measured off of two "seed waves", one which is highlighted on the 5-min chart, the other is indicated on the 15-min chart.
Here's a messy chart with a bunch of Fib. lines of the SPY these past two days. The intention was to show a few things:
1- We sold off to and found support on a 50% extension confluence as measured off of the Previous Day Close (PDC) to the Open and the Previous Day High (PDH) to Low (PDL) range.
2- Price was capped to the upside with another confluence of 50% levels; 50% extensions of two momentum waves, the 50% retracement of the PDO to PDC, and the 50% retracement of the PDH to PDL. I mention these two 50% levels because yesterday happened to be a 2x day (day's range was at least 2x greater than the previous day as explained in this document).
3- The 3/10 macd formed a V-bottom. What I have notice about this reading is that it's best to wait until at least the Slow Line and Fast Line cross before looking to enter long. You can visualize the macd forming a cup and handle pattern if that helps.
In comparison to the V-bottom macd pattern in AMZN today, it's just safer to look for an entry when the Fast Line and Slow Line have crossed:
Another Chart I found interesting was IWM and the number of Reverse & Regular Divergences we've seen these past two sessions.
The setups I include on this blog are used in conjunction with the 3/10macd and the criteria I ascribe to it as a way to alert me to an existing condition of price. The key concept to take away from this blog is that I try to anticipate what will happen on the higher time frame by using a faster time frame to trigger the trade setup. I do not trade a "system" I use two indicators to clue me in to price conditions. Please read the Disclaimer located in the sidebar of this site. I can be contacted via email at toddstrade@gmail.com
I am always open to questions, comments, or suggestions on how to improve this blog.


No comments:
Post a Comment