FCX is testing '09 highs again (3rd week of the last 5). The weekly chart shows some interesting things; for one, the Cup w. handle that formed going back to October '08 and breaking out in July of this year. Also, price now sits at a confluence of resistance in the form of an overhead gap and a 61.8% Fibonnaci retracement level (drawn from '08 highs to '09 lows). The measured move coming out of the cup & handle would put price right up against the 78.6% retracement.

While on the daily chart, price formed another
Cup w. handle pattern recently, with a measured move very close to the one projected on the weekly.

This morning price gaped above a previous resistance level; an important step in making an attempt at the long-term gap fill.

 While on the daily chart, price formed another Cup w. handle pattern recently, with a measured move very close to the one projected on the weekly.
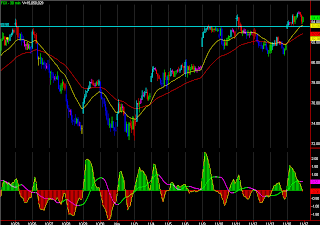
 This morning price gaped above a previous resistance level; an important step in making an attempt at the long-term gap fill.
No comments:
Post a Comment