
large downward momentum (2008)
lower low (2009)
untested highs within 24% of current price. Thinking forward to the 2011 candle, it would appear that price could either roll over or make a charge for new highs

price was sold around the midpoint of the previous downward momentum bar.

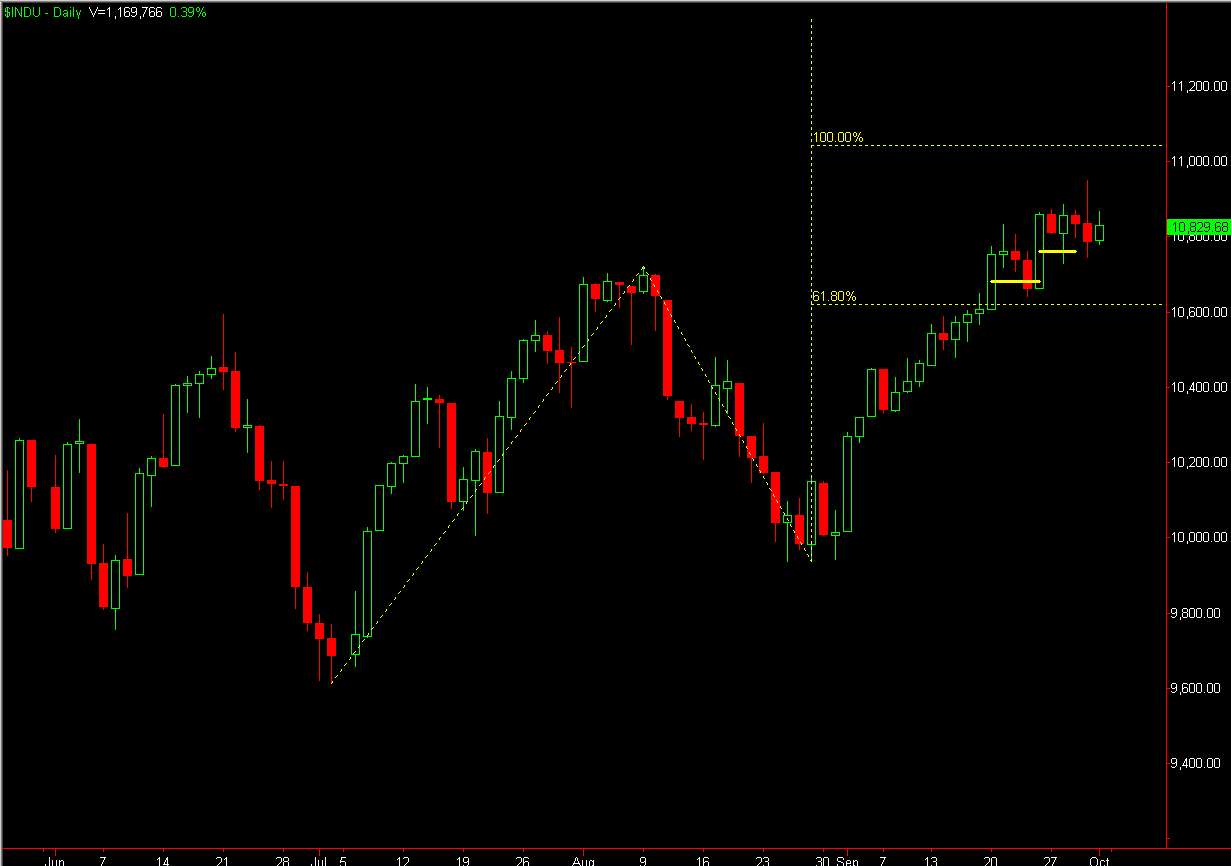
coincides with the 61.8% Fib retracement

The monthly looks to have potential to test up to 12,000, in which case the current bar on the yearly chart might end up looking like that of the previous bar, though with smaller range. Should we get up into the 12,000 level, there may be a lot of exuberance to test higher.

The weekly gave us this nearly completed wave, with a 100% extension just under the previous lows. With price only off of the 2010 highs by 3.8% things could take off if price works off the immediate overhead supply.

While the daily has seen two strong bullish momentum candles that have found buyers within the "dip" range

No comments:
Post a Comment