
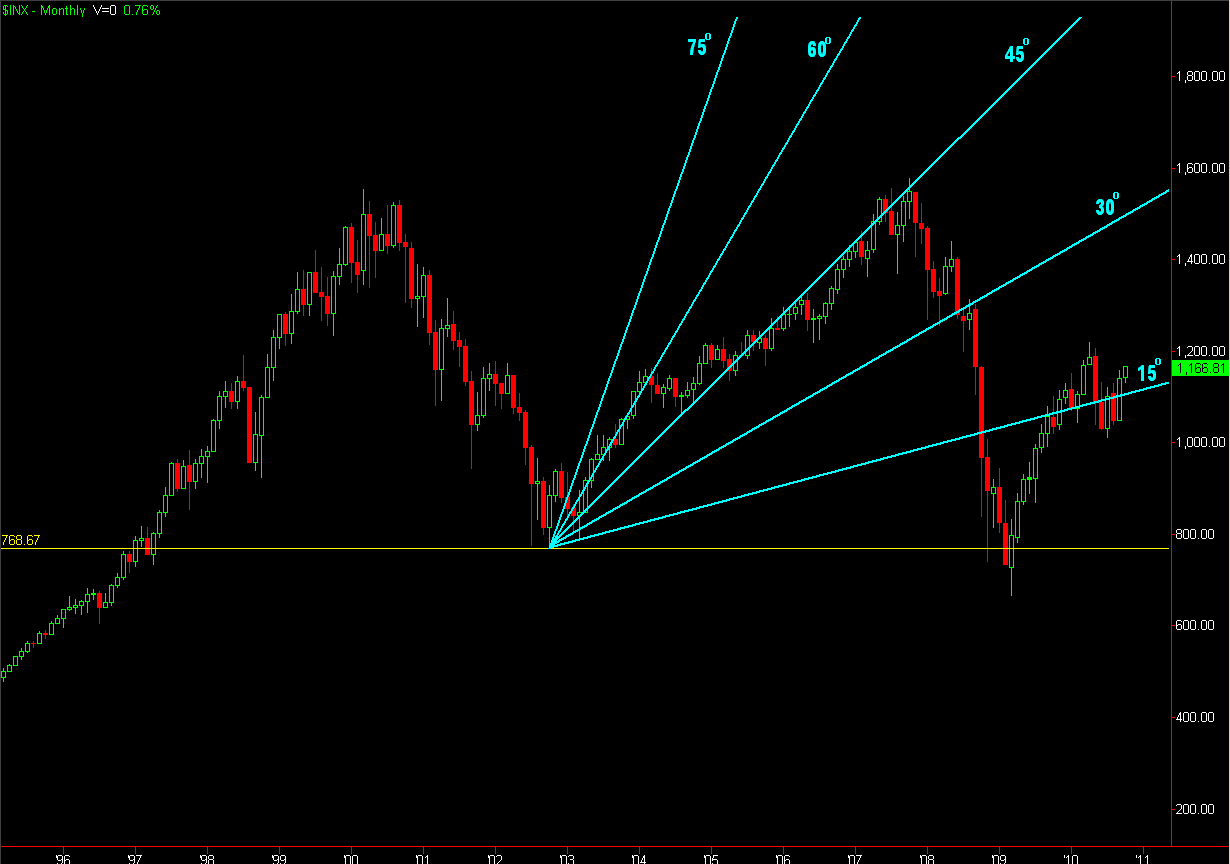
An observation in a way to gauge momentum and speed of price (pace, if you will) using 5 primary angles (7 really, but 90° being straight up and the 0°/180° plane being horizontal, we can get by with just the 5). Those angles being 15°, 30°, 45°, 60°, 75°.
{Warning} there are NO Holy Grails in trading. That being said, these angles aren't meant to be a sell here, buy there strategy. Much the way trendlines are better drawn with a crayon rather than a pencil (so as not to get caught up in jumping to conclusions without confirmation), these angles have some degree for margin of error.
See if you can determine the strength of price when you extend these angles off of pivotal levels. Oh that's right, I told you to move along...
RIMM 60-min chart.

initial momentum spiked at a 75° angle. The first higher low occured right around the 15° angle. Price has since trended along that 15° plane, which gives the impression of uncertainty. One thing in particular which jumps out at me is the lower high sell-offs. Right around 9/25 price made a lower high and sold off with strong momentum before consolidating at the 15° line. More recently, price made another lower high (around 10/05) wherein price sold off with strong momentum before consolidating just below the 15° line and putting in a higher low. Price recovered, but not with the strength it has in the past, which leads me to believe it may be running out of fumes. If I'm wrong, the momentum up would be an obvious tell.
Here's RIMM back in July where it displayed more strength, in the way it formed a bottom and the momentum that lifted it off it's lows:
Once price returned to that gap level there was a long period of sideways consolidation

Here's a weekly chart where I used a point in price and time where price broke out and continued with strong momentum:

The S&P weekly chart after coming off of it's '09 lows. Again, this isn't to show coincidental price breaks or Support/Resistance (though you can watch for them if they display momentum), but more to highlight how price travels before running out of steam in one direction and picking up steam in the other.

Strength the whole way along the 45° line, failure, retest, speed.

So, what's the angle of the dangle?

No comments:
Post a Comment