
Here is POT weekly chart. I drew this one when I first started reading about pitchforks and thought to myself; nah, this is bogus...
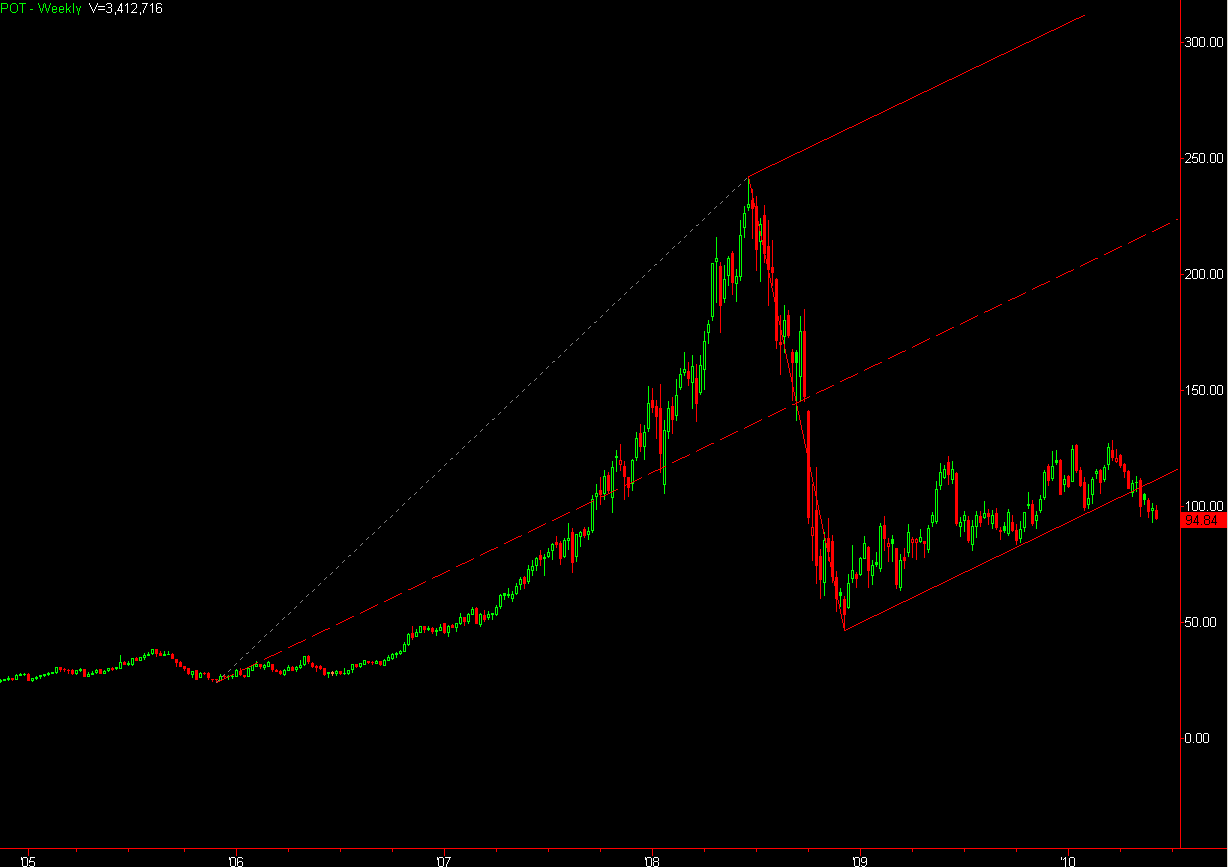 We got two good instances of price tagging the ascending Lower Median Line (LML) and bouncing higher. More recently, however, rather than bounce, price consolidated at the LML before breaking down, indicating that the buying pace has weakened.
RIMM has a similar story as the POT example above; A couple of bounces at the LML before breaking down. RIMM stands at an awfully pivotal level here, a lot of price discovery above and clear air below.

FCX is a really nice example of Support-turned-Resistance-turned-Support, as well as sideways consolidation levels preceding a breakout. Here, price tested the Center Line 4-times. However, the first three times were higher highs, the fourth instance was a lower high reversal pattern.
 The most recent reversal in FCX being a "seed wave" we can get potential targets for Wave3 & W5:
SPY: doesn't look too good :/
The fact that we bounced so hard off the 2009 lows gave a lot of untested price levels. Price failed to tag the Center Line which is supposed to increase the likelihood of a test of the LML, if not the C-pivot low.
 However, if you draw the pitchfork from the '94 lows to the '07 highs and back down to the '09 lows then you do get a successful test of the center line.:
Take a look at the previous SPY projection based off of the 1994-1999-2002 pivots. A few things can be learned from this chart:
 1. Price came back to test the LML after forming the "C" pivot (which turns out to be a great long setup if one is quick to respond).
2. Price fails to touch the Median line before breaking down, giving two possible targets (1. the Warning Line and 2. the C-pivot lows).
 3. The price behavior between 2004-2006 displays choppy, ascending movement that gives you an opportunity to include sliding parallels (included below).
Finally, here's a look at a weekly Dow Jones Industrial Average chart (log-form) going back to 1928 with a Modified Schiff variation pitchfork overlayed.

No comments:
Post a Comment