
Once price gets into an area where traders think a Higher Low may take shape (likely a Fib. level), one of two things can happen:
- Continue lower and test the lows, nullifying a presumption that price was making a higher low.
- Move higher to test the previous swing high and see if there is enough demand to make a new higher high.
Should the latter be true, we then have our "seed wave" in place. Given the speed at which this "wave" forms will determine how high and tight it's trajectory may be. Using the pitchfork helps in visualizing this concept:
 Once this first Median Line is no longer in play we can start using the most recent pivots to give perspective to the trajectory, speed, and energy of price.


Currently POT is in a position where price may be putting in a bottom of some sort:

The most recent pitchfork becomes a process of elimination:
 This process can also help you to look a little closer at what price is doing
 Eventually the energy will tire once a level is reached where buyers are collectively interested. Until then, you keep moving the Lower Median Line down until the first seed wave holds and the highs above bring demand rather than supply.
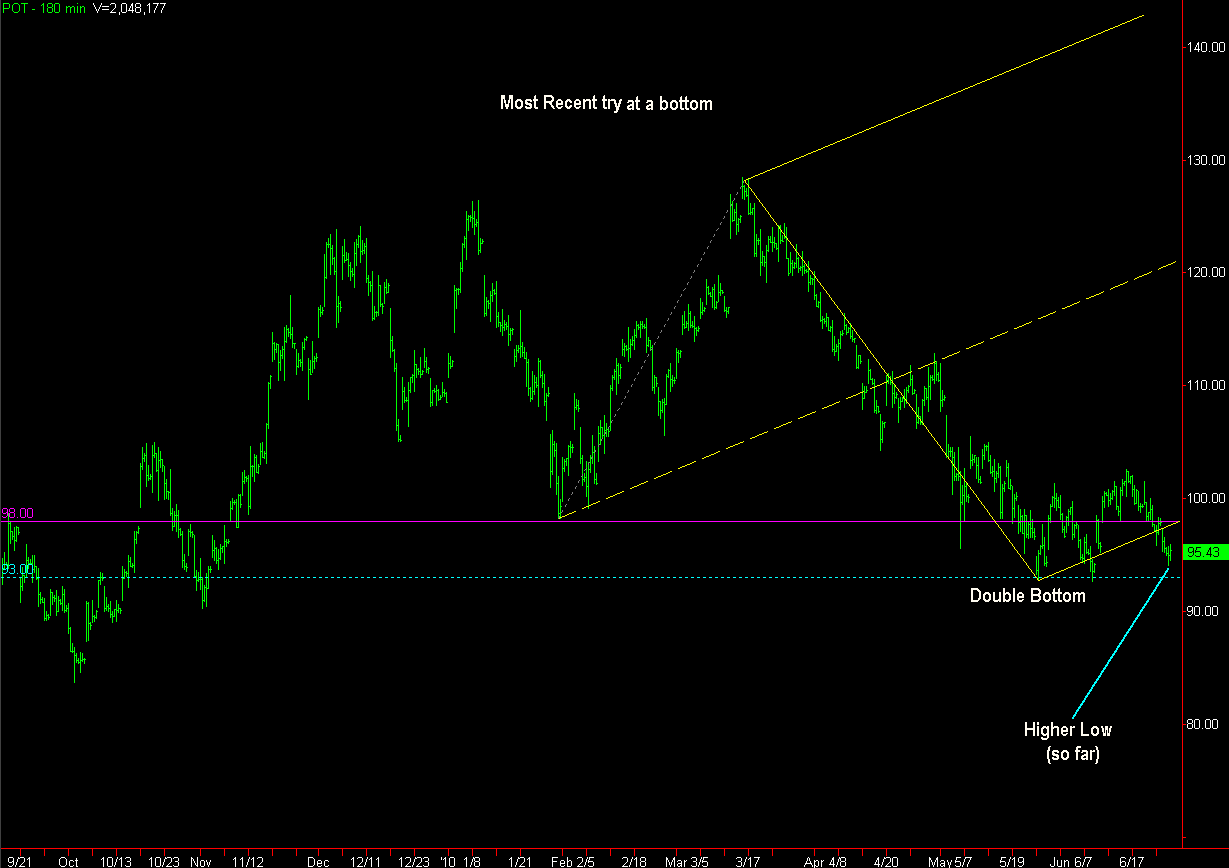
Currently the Higher Low in POT stands around $94 (right around the 78.6% retracement), so a test lower and it would seem we could keeping testing lower (even if for just an instant, a new seed wave would then take shape) until volume comes in to support a price. If $94 holds as the Higher Low, $98 followed by $104 can be in play.
 There is now a Longer-term pitchfork in play, adjusting as our lows are made, and shorter time frame pitchforks to gauge your trading time frame potential setups.
  In this image above the purple pitchfork is nullified. The yellow pitchfork shows price pulling back to the Lower Median Line (LML) that also happens to be the LML of our longer term pitchfork (red). Price showing support at $96 could be a good entry long (as a day trade) imo.
1 comment:
Does anybody ELSE understand what the hell is going on here? lol
Post a Comment