Interesting pitchfork confluence in some issues.
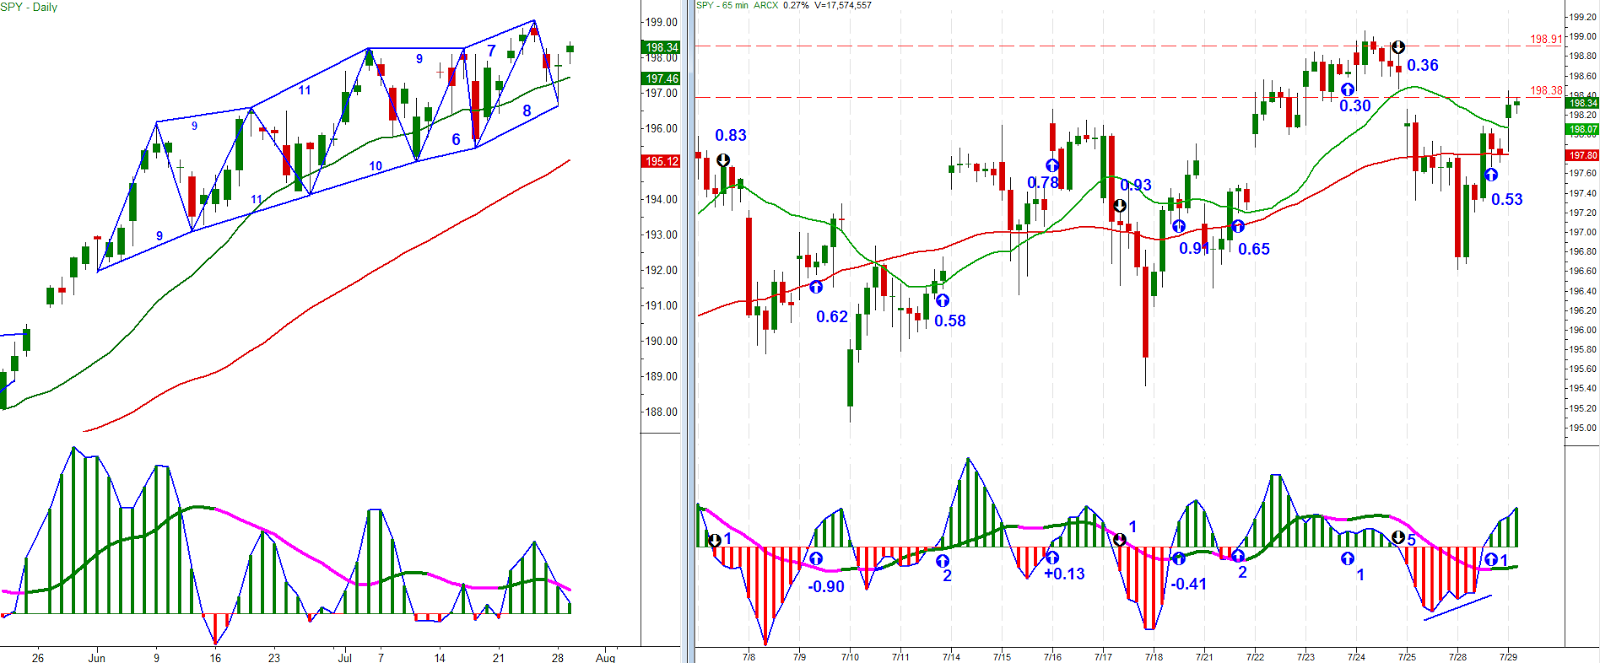
SPY sitting at upper median line
XLF - been riding the lower median line for quite a while, now throwing back
IWM - two failures to break UML
QQQ - on a strong trajectory
DIA - 3 successful bounces at lower median line
Here's an updated look at the SPY cycle count
Dow Jones Quarterly long term