The setups I include on this blog are used in conjunction with the 3/10macd and the criteria I ascribe to it as a way to alert me to an existing condition of price. The key concept to take away from this blog is that I try to anticipate what will happen on the higher time frame by using a faster time frame to trigger the trade setup. I do not trade a "system" I use two indicators to clue me in to price conditions. Please read the Disclaimer located in the sidebar of this site. I can be contacted via email at toddstrade@gmail.com
I am always open to questions, comments, or suggestions on how to improve this blog.


Wednesday, November 27, 2013

fast line

Just a comparison of three indexes Daily (below, left) with hourly (below, right).
Often when the slow line is sloping down (criteria '2') and the fast line is below it the move can be more muted/choppy.
 SPY - slow line sloping down and fast line bumping into it; the breakout (below, left and second to right up arrow) was successful, but the most recent one was more muted (note hourly below, right fast line < slow line as we consolidate, can still break higher and see a fast/slow line cross).

QQQ - Daily (below, left) the most recent up arrow saw the fast line clearing above the slow line

IWM - Daily (below, left) fast line is decidedly above slow line.  Most recent break out saw much more momentum than the SPY

Friday, November 22, 2013

update

charts and potential entries updated from yesterday
SPY

QQQ - lagging a bit


Daily finally got the fast line tick up (anticipated by using the hourly to enter).  While it can be considered an entry long on this (daily) time frame it becomes sketchy at this point being that we're so late in the move.

On second thought...lol

Thursday, November 21, 2013

squeeze train

Red day?  Buy it.  Taper?  Buy it?  Outside reversal?  Buy it.  Bearish engulfing?  Buy it.  lol and so it goes.

     Just some 15-min charts with potential entry arrows.
  The very bottom indicator is the 3/10macd for the time frame of the chart (15-min), while the indicator above it reflects the time frame approximately 3x higher/slower.  Bear in mind, the exits for such trades are not indicated; they are a discretionary determination.  Targets are sually based on the distance between the entry and a recent pivot.  I also use the 3/10macd to cue me to exit for taking a loss (if the slow line & fast line disagree or if the fast line ticks down, that sort of thing).

SPY - under resistance.  Gap up and run, or fade?

IWM - nice and clear 3d criteria setup on the higher time frame (highlighted).  Breakout tomorrow, or is this a double-top?

QQQ - at resistance

An updated chart of the daily/hourly posted yesterday.  Still no certainty with the daily.  Today's buy trigger on the hourly can lead to a breakout tomorrow, thereby pulling the daily fast line up, but the hourly reverse divergence and small bodied doji's at resistance are reason to be quick on the cover/reverse button if it threatens the 179.36 area.

Wednesday, November 20, 2013

no follow through

We didn't get any bullish follow-through after the faster time frame (hourly) had a positive fast line change.  The '4a' criteria (slow line negative and ticking down with a positive fast line) will always be a suspect entry, if there is no immediate momentum to follow (the momentum is needed to pull the slow line from criteria '4' to '3' and eventually to '1').  A better setup would be for the fast line to turn positive then pull back into a positive slow line before continuing higher.

Trying to get a jump on the potential higher time frame shift we can add the 15-minute chart into the mix (below, right).
We had an entry in the morning, but rejection at resistance was evident and eventually a fast line/slow line cross was a warning sign for potential time/price correction (also note bearish moving averages).  Going into the afternoon we had an either/or scenario (price could have gone either way) take place into FOMC minutes at 1:00pm CT but the selling trigger ended up giving a measured move.

Now, if looking for a long entry we can start by waiting for the 15-min time frame to develop more of a bullish criteria (FL > SL with a slow line positive and closer to the zero-line, maybe a 3d to 3a to 1a, similar to what we saw late afternoon yesterday and early this morning).

Wed. 11_20

Watching the faster time frame to clue us in to further upside (or downside).
The daily 3/10macd fast line will either tick up from here (1b to 1a) or cross the slow line and likely trigger a steeper correction (1b to 2c).  Looking to the faster time frame (hourly chart on right) we would like to see the fast line on the 3/10macd cross the slow line and turn positive to go long (which would then turn the fast line up on the daily chart.

Wednesday, November 13, 2013

Wed 11_13

We've been waiting for the 3/10macd fast line and slow line to catch up with one another again, which will probably take place on tomorrow's open.  By that time, the move is stretched and one would be buying late into that time frame.  So, we need a way to anticipate this potential move by clueing off of a faster time frame.
Here is the Daily (left) 1H (middle) and 15-min time frames

Momentum is in progress, and the only thing to look out for would be lack of follow-through once the first round of selling has occurred.  It is Options Expiration week and anything can happen.

Just looking at the higher time frames things are still pretty bullish.
This Daily chart has two macd indicators.  The bottom is the standard 3/10-macd that reflects the Daily time frame; the one above it is a macd that reflects a time frame three times slower (closely mimics the weekly 3/10 macd).
Included are potential entry considerations for the daily time frame.  The highlighted regions are indicating like occurrences, in this case, where the fast line was less than the slow line once the fast line turned back up to positive from negative .  So the most recent long "triggers" have taken place, but since the fast line is less than the slow line I would look to exit on the daily fast line ticking back down, the way it did in August.


cycles

Food for thought:
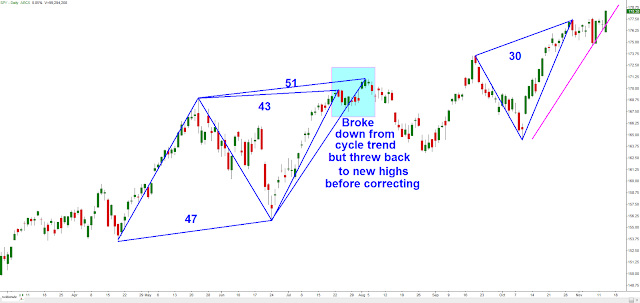
 Very symmetrical cycle count leading up to this breakout.  It is easily possible that this current inverted cycle could last another 18-days and it would be symmetrical with the preceding 22-day regular cycle.


There is a caveat:
The second and third cycles in the image above (marked 51 and 47 respectively) have a price behavior pattern that is similar to a 'throwback' to a trend line.  Being that the Cyclic Trend Line (CTL) is so steep, price naturally "breaks down" from it out of the sheer speed of the move.  But because the prevailing move was so strong this is seen as a buyable pullback (channel on a faster time frame perhaps) and so it makes a new high while throwing back to the CTL which, in turn, warrants a re-drawing of the CTL and giving us a new boundary for the beginning of our next cycle.

These next two charts illustrate what I'm trying to convey.


So, that 'caveat' being that there is potential for the same thing to be taking place currently, as is shown in the chart below:

Friday, November 8, 2013

Bonds

Big move in bonds today.
30-year T-bond yield TYX -  looks like a move to 41 supply point

10-year Treasury Note yield $TNX broke out of this down trend line and held a throwback to this trend line

5-year Treasury Note yield $FVX - more muted

TLT fell apart after testing the down trending 20-period SMA

INX (top) 30-yr (bottom)

So.  Yields up, attempting to advertise lower rates.  What does it all mean?

Thursday, November 7, 2013

waiting

A method I employ to allow momentum time to digest is by trading on the "right side" of the 3/10macd fast and slow lines.  "Right side" meaning, if I'm looking for a long entry I prefer to have the fast line greater than the slow line, or at least close enough to where I can anticipate this to happen.
In this Daily chart below of the SPY the fast line went under the slow line (most recently) on Oct. 30th, so before entertaining a long entry I prefer to wait until the fast line and slow line catch up to one another again.  This isn't to say that price can not go higher, it's just a way of allowing previous momentum time to digest.
Other examples are highlighted in the chart below coinciding with potential long entries.  There was a faded breakout in June, but it is a good reminder that nothing is ever perfect in this game.