The setups I include on this blog are used in conjunction with the 3/10macd and the criteria I ascribe to it as a way to alert me to an existing condition of price. The key concept to take away from this blog is that I try to anticipate what will happen on the higher time frame by using a faster time frame to trigger the trade setup. I do not trade a "system" I use two indicators to clue me in to price conditions. Please read the Disclaimer located in the sidebar of this site. I can be contacted via email at toddstrade@gmail.com
I am always open to questions, comments, or suggestions on how to improve this blog.


Tuesday, April 30, 2013

Tue. 04_30

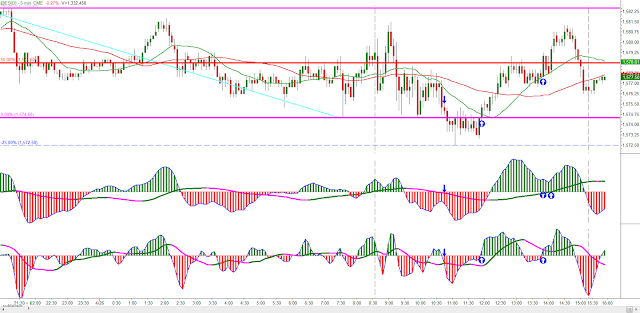
Held the 50% retrace from Friday's low to Monday's high, back to close on the highs for the last day of April.  Got a little chopped up into the last hour.

Volume Profile coming into the day.  A very similar profile formed today as it was yesterday.  Today we filled in the low volume node area in the $158.70-.90 range, still a large volume node (acceptance) in the 59.40 - 59.70 area.

ES with globex


 Another bar in the books for the monthly time frame.  8th month into our inverted cycle (as goes the Stevenson PTT concept)


Monday, April 29, 2013

Mon 04_29

A key for the above (5-min) chart to define the horizontal lines and dots.  For further explanation, see this link:  

First hour:

Breadth - started out pretty strong in the morning, rermaind so throughout the day

Volume profile coming into the day

The weekly SPY has been showing this divergence for some time now (similar to the "overbought can remain so for a long time" a divergence can see price continue to go contrary to the divergent signal).  The daily is clearly showing a cycle environment.  While it could be a topping pattern a move out of this INX 1600 ceiling on momentum should result in a measured move higher.  So far the SPY is in a double-top with potential for a complex Head & Shoulders pattern.  Wednesday is May 1 (sell in May cliche) AND a Fed day FYI

Saturday, April 27, 2013

Fri. 04_26

Got a bit chopped up in the morning and had to leave just as the noon trigger was occuring.  Difficult taking a short when the 5-min slow line has a positive slope (criteria 3).

Very choppy in the morning as price was working in the previous High Volume area from the 24th ($157.99)

ES with globex.

Thursday, April 25, 2013

Thu. 04_25

Interesting day, a lot of offers in the afternoon; pretty early in the afternoon as well, not your usual 2:30 selling
A key for the above (5-min) chart to define the horizontal lines and dots.  For further explanation, see this link:  


breadth-

Volume profile - perfect tag of the naked vpoc at $159.27

ES with globex

Wednesday, April 24, 2013

Wed. 04_24

Horizontal development is torture.  It is also very easy to get chopped up without patience.  This volume profile (below, most recent) is what I mean by "horizontal development".  After testing a price point above (low volume node, blue line) and a price point below (high volume nodes, red lines), price coils sideways between the two and edges are faded, so you end up buying a breakout higher that gets sold or lower that gets bought:

Anyway,   A few paper-cuts in the late morning

Breadth today - Advance/Decline took a hit early in the morning, and remained slightly better than neutral (divergence with price?).

Volume profile didn't change too much

ES with globex

Tuesday, April 23, 2013

Tue. 04_23

Extreme advancing days you really need to be in before the first hour.  The 5min 3/10 macd will be practically useless as well (if you want a good price), so you have to either buy some form of support (vwap, pdh, o/s, etc) and/or go to an even faster time frame for entry cues.
The problem is knowing when you are in an extreme advancing environment before the first hour has traded.
Opening with a 1a criteria (or 4c in the case of an extreme declining day) is my first clue.  The extent of the gap involved (there is most often an impulsive gap) and behavior in premarket.  Finally, some breadth readings to help you feel like the wind is in your sails.
 Breadth started strong (TICK opened +1000)

Opening hour- pullback to the Open and vwap coinciding with the pre-market high $157

Lucky exit before the tweet-crash

Volume profile coming into the day, we settled right back into price familiarity

ES_globex.  Very interesting that the tweet-crash bounced at the overnight range midpoint, on the dot

Monday, April 22, 2013

Mon 04_22


 A typical move you see a lot of in the SPY; Higher high price breakout (1), pullback making a lower low (2) but price retains a significant level on multiple tests (more visible on the faster time frame), which lead to  price squeezing higher.

today's breadth

Opening swing and first hour (Initial Balance).  Very wide IB range today, yet the high was still taken out (higher value being priced in).

Volume Profile coming into today
Volume Profile going forward

ES globex, Opening session in black vertical dash line, arrows indicating entry potentials

Higher time frame:  Daily price is spending a good deal of time within the 20- & 50-day MA window.  A large gap remains overhead, and it would be healthy to spend some time auctioning this gap range, but a 65-min fast line/slow line cross would temporarily change this higher time frame bullishness.


Crude Oil-

Gold -

Friday, April 19, 2013

Fri. 04_19

Got chopped up in the middle-morning and took early "signals" later on
A key for the above (5-min) chart to define the horizontal lines and dots.  For further explanation, see this link:  


First hour

Breadth

Volume profile coming into the day, the opening rotations tested the previous day's High Volume Nodes

ES globex - basically the faster time frame "triggered" around the same time that the higher time frame did which resulted in a wider stop tolerance needed and longer patience for the consolidation ro resolve

Higher time frame - still potential for the faster time frame (65min) to pull back (fast line pull back to the slow line), but equally likely for a trend line break and a move back to the $157 area

Thursday, April 18, 2013

Thu. 04_18


A key for the above (5-min) chart to define the horizontal lines and dots.  For further explanation, see this link:  

Divergences in breadth today; S&P500 Advancing/Declining on the left, Up/Down Volume on the right

First hour's trade (Initial Balance)

With volume profile

Daily showing 2c-2d criteria (looking for the 65min chart fast line to go green for a long signal).  So long as the March gap holds we can perceive the daily 3/10macd to be a reverse divergence (still not actionable until the 65min fast line goes positive).

ES with globex.  Two 3/10 macd's to reflect two time frames in one (top indicator being the 15-min 3/10macd)